Note
Go to the end to download the full example code
Plot a bar chart of classifications
This is an example showing how to produce a bar chart showing the percentage abundance of each classification in a 2D or 3D array of classifications.
First we shall create a random 3D grid of classifications that can be plotted.
Usually you would use a method such as
mcalf.models.ModelBase.classify_spectra()
to classify an array of spectra.
Next, we shall import mcalf.visualisation.bar().
from mcalf.visualisation import bar
We can now simply plot the 3D array. By default, the first dimension of a 3D array will be averaged to produce a time average, selecting the most common classification at each (x, y) coordinate. This means the percentage abundances will correspond to the most common classification at each coordinate.
bar(class_map)
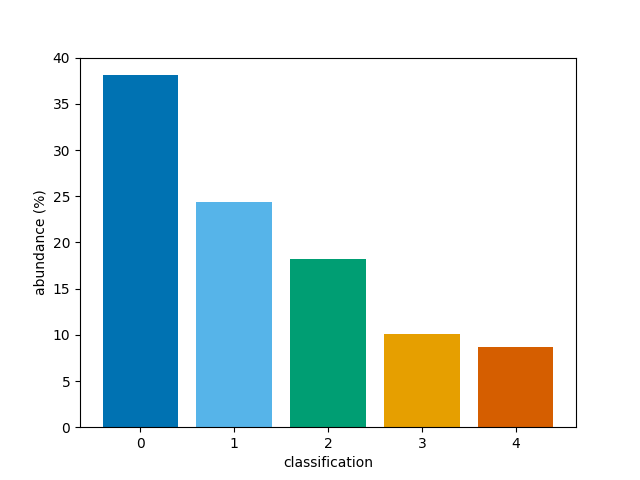
<BarContainer object of 5 artists>
Instead, the percentage abundances can be determined for the whole
3D array of classifications by setting reduce=True.
This skips the averaging process.
bar(class_map, reduce=False)
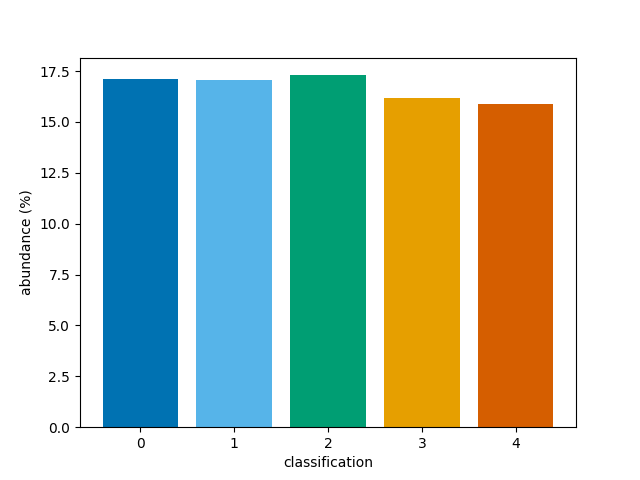
<BarContainer object of 5 artists>
Alternatively, a 2D array can be passed to the function.
If a 2D array is passed, no averaging is needed, and
the reduce parameter is ignored.
A narrower range of classifications to be plotted can be
requested with the vmin and vmax parameters.
To show bars for only classifcations 1, 2, and 3,
bar(class_map, vmin=1, vmax=3)
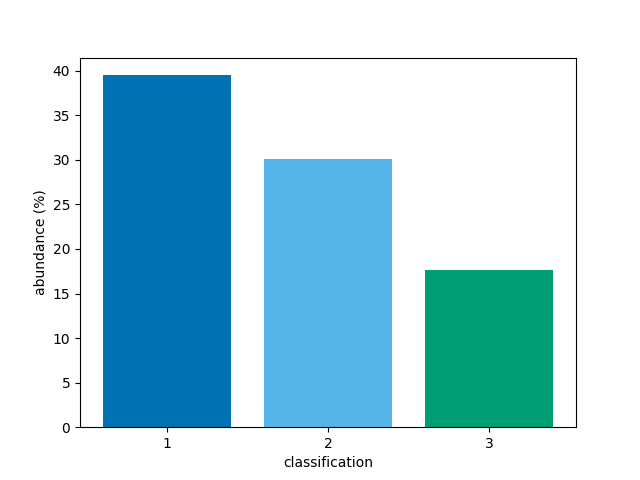
<BarContainer object of 3 artists>
An alternative set of colours can be requested.
Passing a name of a matplotlib colormap to the
style parameter will produce a corresponding
list of colours for each of the bars.
For advanced use, explore the cmap parameter.
bar(class_map, style='viridis')
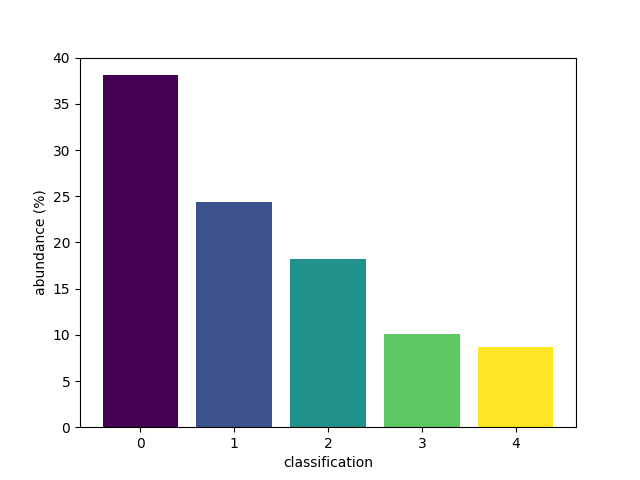
<BarContainer object of 5 artists>
The bar function integrates well with matplotlib, allowing extensive flexibility.
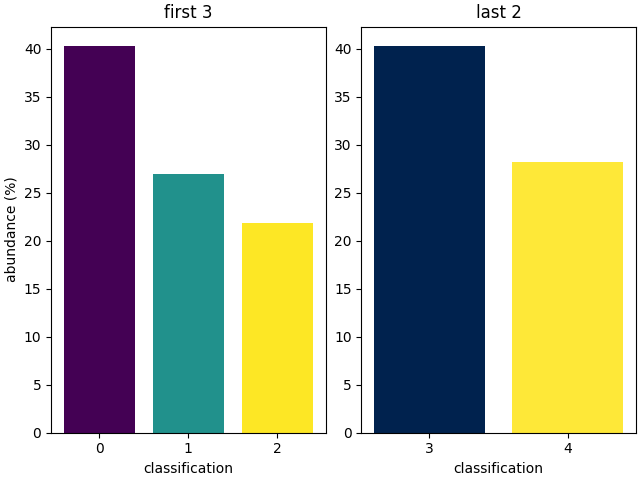
Note that vmin and vmax are applied before the
reduce value is applied. So setting these ranges
can change the calculated abundances for other
classifications if class_map is 3D and
reduce=True.
The bars do not add up to 100% as a bar for
negative, invalid classifications (and therefore
classifications out of the vmin and vmax
range) is not shown.
Total running time of the script: ( 0 minutes 1.081 seconds)