bar
- mcalf.visualisation.bar(class_map=None, vmin=None, vmax=None, reduce=True, style='original', cmap=None, ax=None, data=None)[source]
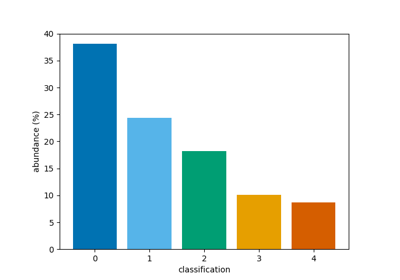
Plot a bar chart of the classification abundances.
- Parameters:
class_map (numpy.ndarray[int], ndim=2 or 3) – Array of classifications. If the array is three-dimensional, it is assumed that the first dimension is time, and a time average classification will be plotted. The time average is the most common positive (valid) classification at each pixel.
vmin (int, optional, default=None) – Minimum classification integer to plot. Must be greater or equal to zero. Defaults to min positive integer in class_map.
vmax (int, optional, default=None) – Maximum classification integer to plot. Must be greater than zero. Defaults to max positive integer in class_map.
reduce (bool, optional, default=True) – Whether to perform the time average described in class_map info.
style (str, optional, default='original') – The named matplotlib colormap to extract a
ListedColormapfrom. Colours are selected from vmin to vmax at equidistant values in the range [0, 1]. TheListedColormapproduced will also show bad classifications and classifications out of range in grey. The default ‘original’ is a special case used since early versions of this code. It is a hardcoded list of 5 colours. When the number of classifications exceeds 5,style='viridis'will be used.cmap (str or matplotlib.colors.Colormap, optional, default=None) – Parameter to pass to matplotlib.axes.Axes.imshow. This parameter overrides any cmap requested via the style parameter.
ax (matplotlib.axes.Axes, optional, default=None) – Axes into which the velocity map will be plotted. Defaults to the current axis of the current figure.
data (dict, optional, default=None) – Dictionary of common classification plotting settings generated by
init_class_data(). If present, all other parameters are ignored except and ax.
- Returns:
b – The object returned by
matplotlib.axes.Axes.bar()after plotting abundances.- Return type:
See also
mcalf.models.ModelBase.classify_spectraClassify spectra.
mcalf.utils.smooth.average_classificationAverage a 3D array of classifications.
Notes
Visualisation assumes that all integers between vmin and vmax are valid classifications, even if they do not appear in class_map.
Examples