Contents:
Below are examples of plots produced using functions within the visualisation module:
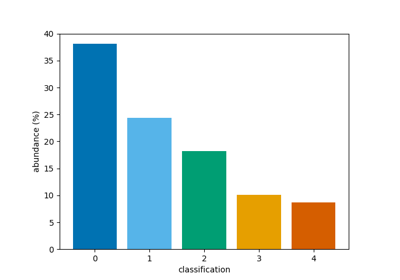
Plot a bar chart of classifications
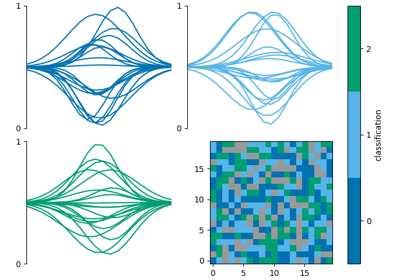
Combine multiple classification plots
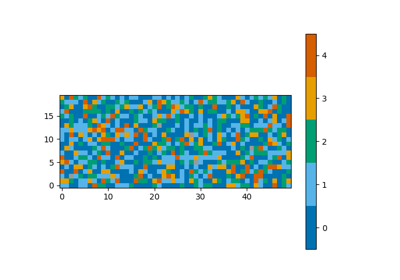
Plot a map of classifications
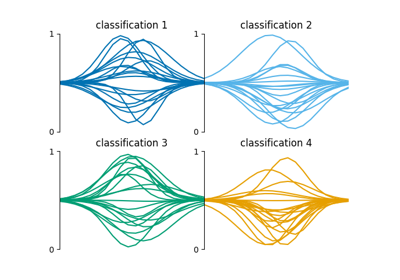
Plot a grid of spectra grouped by classification
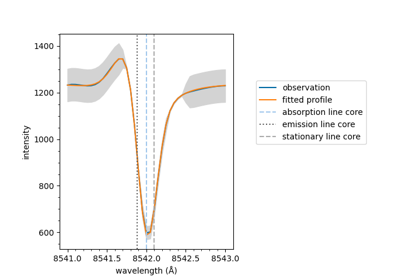
Plot a fitted spectrum
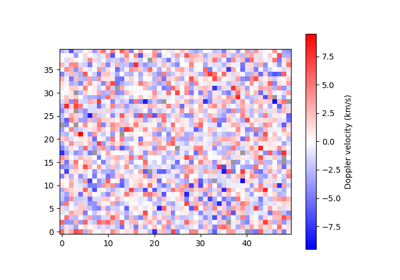
Plot a map of velocities
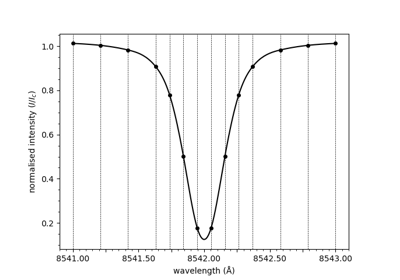
Plot a spectrum