plot_map
- mcalf.visualisation.plot_map(arr, mask=None, umbra_mask=None, resolution=None, offset=(0, 0), vmin=None, vmax=None, lw=None, show_colorbar=True, unit='km/s', ax=None)[source]
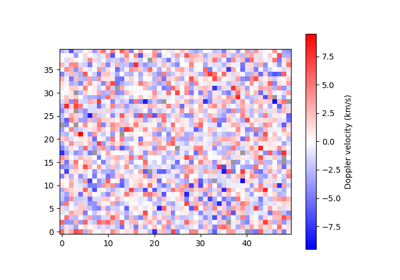
Plot a velocity map array.
- Parameters:
arr (numpy.ndarray[float] or astropy.units.quantity.Quantity, ndim=2) – Two-dimensional array of velocities.
mask (numpy.ndarray[bool], ndim=2, shape=arr, optional, default=None) – Mask showing the region where velocities were found for. True is outside the velocity region and False is where valid velocities should be found. Specifying a mask allows for errors in the velocity calculation to be black and points outside the region to be gray. If omitted, all invalid points will be gray.
umbra_mask (numpy.ndarray[bool], ndim=2, shape=arr, optional, default=None) – A mask of the umbra, True outside, False inside. If given, a contour will outline the umbra, or other feature the mask represents.
resolution (tuple[float] or astropy.units.quantity.Quantity, optional, default=None) – A 2-tuple (x, y) containing the length of each pixel in the x and y direction respectively. If a value has type
astropy.units.quantity.Quantity, its axis label will include its attached unit, otherwise the unit will default to Mm. If resolution is None, both axes will be ticked with the default pixel value with no axis labels.offset (tuple[float] or int, length=2, optional, default=(0, 0)) – Two offset values (x, y) for the x and y axis respectively. Number of pixels from the 0 pixel to the first pixel. Defaults to the first pixel being at 0 length units. For example, in a 1000 pixel wide dataset, setting offset to -500 would place the 0 Mm location at the centre.
vmin (float, optional, default=
-max(|arr|)) – Minimum velocity to plot. If not given, will be -vmax, for vmax not None.vmax (float, optional, default=
max(|arr|)) – Maximum velocity to plot. If not given, will be -vmin, for vmin not None.lw (float, optional, default=None) – The line width of the contour line plotted for umbra_mask. Passed as linewidths to
matplotlib.axes.Axes.contour().show_colorbar (bool, optional, default=True) – Whether to draw a colorbar.
unit (str or astropy.units.UnitBase or astropy.units.quantity.Quantity, optional, default='km/s') – The units of arr data. Printed on colorbar.
ax (matplotlib.axes.Axes, optional, default=None) – Axes into which the velocity map will be plotted. Defaults to the current axis of the current figure.
- Returns:
im – The object returned by
matplotlib.axes.Axes.imshow()after plotting arr.- Return type:
See also
mcalf.models.FitResults.velocitiesCalculate the Doppler velocities for an array of fits.
Examples