plot_spectrum
- mcalf.visualisation.plot_spectrum(wavelengths, spectrum, normalised=True, smooth=True, ax=None)[source]
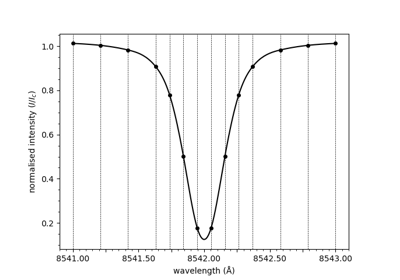
Plot a spectrum with the wavelength grid shown.
Intended for plotting the raw data.
- Parameters:
wavelengths (numpy.ndarray) – The x-axis values.
spectrum (numpy.ndarray, length=n_wavelengths) – The y-axis values.
normalised (bool, optional, default=True) – Whether to normalise the spectrum using the last three spectral points.
smooth (bool, optional, default=True) – Whether to smooth the spectrum with a spline.
ax (matplotlib.axes.Axes, optional, default=None) – Axes into which the fit will be plotted. Defaults to the current axis of the current figure.
- Returns:
ax – Axes the lines are drawn on.
- Return type:
Examples