plot_classifications
- mcalf.visualisation.plot_classifications(spectra, labels, nrows=None, ncols=None, nlines=20, style='original', cmap=None, show_labels=True, plot_settings={}, fig=None)[source]
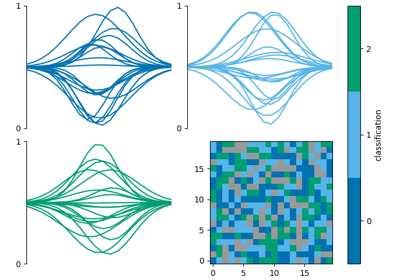
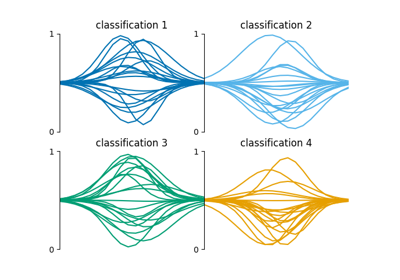
Plot spectra grouped by their labelled classification.
- Parameters:
spectra (ndarray, ndim=2) – Two-dimensional array with dimensions [spectra, wavelengths].
labels (ndarray, ndim=1, length of spectra) – List of classifications for each spectrum in spectra.
nrows (int, optional, default=None) – Number of rows. Defaults to rows of max width 3 axes. Special case: four plots will be in a 2x2 grid. Only one of nrows and ncols can be specified.
ncols (int, optional, default=None) – Number of columns. Defaults to rows of max width 3 axes. Special case: four plots will be in a 2x2 grid. Only one of nrows and ncols can be specified.
nlines (int, optional, default=20) – Maximum number of lines per classification plot.
style (str, optional, default='original') – The named matplotlib colormap to extract a
ListedColormapfrom. Colours are selected from vmin to vmax at equidistant values in the range [0, 1]. TheListedColormapproduced will also show bad classifications and classifications out of range in grey. The default ‘original’ is a special case used since early versions of this code. It is a hardcoded list of 5 colours. When the number of classifications exceeds 5,style='viridis'will be used.cmap (callable, optional, default=None) – Function that returns a colour for each input from zero to num. classifications. This parameter overrides any cmap requested via the style parameter. Return value is passed to the color parameter of
matplotlib.pyplot.axes.Axes.plot().show_labels (bool, optional, default=True) – Whether to label the axes with the corresponding classifications.
plot_settings (dict, optional, default={}) – Dictionary of keyword arguments to pass to
matplotlib.pyplot.axes.Axes.plot().fig (matplotlib.figure.Figure, optional, default=None) – Figure into which the classifications will be plotted. Defaults to the current figure.
- Returns:
gs – The grid layout subplots are placed on within the figure.
- Return type:
Examples