IBIS8542Model
-
class
mcalf.models.IBIS8542Model(**kwargs)[source]¶ Bases:
mcalf.models.base.ModelBaseClass for working with IBIS 8542 Å calcium II spectral imaging observations.
- Parameters
absorption_guess (array_like, length=4, optional, default=[-1000, stationary_line_core, 0.2, 0.1]) – Initial guess to take when fitting the absorption Voigt profile.
emission_guess (array_like, length=4, optional, default=[1000, stationary_line_core, 0.2, 0.1]) – Initial guess to take when fitting the emission Voigt profile.
absorption_min_bound (array_like, length=4, optional, default=[-np.inf, stationary_line_core-0.15, 1e-6, 1e-6]) – Minimum bounds for all the absorption Voigt profile parameters in order of the function’s arguments.
emission_min_bound (array_like, length=4, optional, default=[0, -np.inf, 1e-6, 1e-6]) – Minimum bounds for all the emission Voigt profile parameters in order of the function’s arguments.
absorption_max_bound (array_like, length=4, optional, default=[0, stationary_line_core+0.15, 1, 1]) – Maximum bounds for all the absorption Voigt profile parameters in order of the function’s arguments.
emission_max_bound (array_like, length=4, optional, default=[np.inf, np.inf, 1, 1]) – Maximum bounds for all the emission Voigt profile parameters in order of the function’s arguments.
absorption_x_scale (array_like, length=4, optional, default=[1500, 0.2, 0.3, 0.5]) – Characteristic scale for all the absorption Voigt profile parameters in order of the function’s arguments.
emission_x_scale (array_like, length=4, optional, default=[1500, 0.2, 0.3, 0.5]) – Characteristic scale for all the emission Voigt profile parameters in order of the function’s arguments.
random_state (int, numpy.random.RandomState, optional, default=None) – Determines random number generation for weights and bias initialisation of the default neural_network. Pass an int for reproducible results across multiple function calls.
original_wavelengths (array_like) – One-dimensional array of wavelengths that correspond to the uncorrected spectral data.
stationary_line_core (float, optional, default=8542.099145376844) – Wavelength of the stationary line core.
constant_wavelengths (array_like, ndim=1, optional, default= see description) – The desired set of wavelengths that the spectral data should be rescaled to represent. It is assumed that these have constant spacing, but that may not be a requirement if you specify your own array. The default value is an array from the minimum to the maximum wavelength of original_wavelengths in constant steps of delta_lambda, overshooting the upper bound if the maximum wavelength has not been reached.
delta_lambda (float, optional, default=0.05) – The step used between each value of constant_wavelengths when its default value has to be calculated.
sigma (list of array_like or bool, length=(2, n_wavelengths), optional, default=[type1, type2]) – A list of different sigma that are used to weight particular wavelengths along the spectra when fitting. The fitting method will expect to be able to choose a sigma array from this list at a specific index. It’s default value is [generate_sigma(i, constant_wavelengths, stationary_line_core) for i in [1, 2]]. See
mcalf.utils.spec.generate_sigma()for more information. If bool, True will generate the default sigma value regardless of the value specified in config, and False will set sigma to be all ones, effectively disabling it.prefilter_response (array_like, length=n_wavelengths, optional, default= see note) – Each constant wavelength scaled spectrum will be corrected by dividing it by this array. If prefilter_response is not given, and prefilter_ref_main and prefilter_ref_wvscl are not given, prefilter_response will have a default value of None.
prefilter_ref_main (array_like, optional, default= None) – If prefilter_response is not specified, this will be used along with prefilter_ref_wvscl to generate the default value of prefilter_response.
prefilter_ref_wvscl (array_like, optional, default=None) – If prefilter_response is not specified, this will be used along with prefilter_ref_main to generate the default value of prefilter_response.
config (str, optional, default=None) – Filename of a .yml file (relative to current directory) containing the initialising parameters for this object. Parameters provided explicitly to the object upon initialisation will override any provided in this file. All (or some) parameters that this object accepts can be specified in this file, except neural_network and config. Each line of the file should specify a different parameter and be formatted like emission_guess: ‘[-inf, wl-0.15, 1e-6, 1e-6]’ or original_wavelengths: ‘original.fits’ for example. When specifying a string, use ‘inf’ to represent np.inf and ‘wl’ to represent stationary_line_core as shown. If the string matches a file,
mcalf.utils.misc.load_parameter()is used to load the contents of the file.output (str, optional, default=None) – If the program wants to output data, it will place it relative to the location specified by this parameter. Some methods will only save data to a file if this parameter is not None. Such cases will be documented where relevant.
-
absorption_guess¶ Initial guess to take when fitting the absorption Voigt profile.
- Type
array_like, length=4, optional, default=[-1000, stationary_line_core, 0.2, 0.1]
-
emission_guess¶ Initial guess to take when fitting the emission Voigt profile.
- Type
array_like, length=4, optional, default=[1000, stationary_line_core, 0.2, 0.1]
-
absorption_min_bound¶ Minimum bounds for all the absorption Voigt profile parameters in order of the function’s arguments.
- Type
array_like, length=4, optional, default=[-np.inf, stationary_line_core-0.15, 1e-6, 1e-6]
-
emission_min_bound¶ Minimum bounds for all the emission Voigt profile parameters in order of the function’s arguments.
- Type
array_like, length=4, optional, default=[0, -np.inf, 1e-6, 1e-6]
-
absorption_max_bound¶ Maximum bounds for all the absorption Voigt profile parameters in order of the function’s arguments.
- Type
array_like, length=4, optional, default=[0, stationary_line_core+0.15, 1, 1]
-
emission_max_bound¶ Maximum bounds for all the emission Voigt profile parameters in order of the function’s arguments.
- Type
array_like, length=4, optional, default=[np.inf, np.inf, 1, 1]
-
absorption_x_scale¶ Characteristic scale for all the absorption Voigt profile parameters in order of the function’s arguments.
- Type
array_like, length=4, optional, default=[1500, 0.2, 0.3, 0.5]
-
emission_x_scale¶ Characteristic scale for all the emission Voigt profile parameters in order of the function’s arguments.
- Type
array_like, length=4, optional, default=[1500, 0.2, 0.3, 0.5]
-
random_state¶ Determines random number generation for weights and bias initialisation of the default neural_network. Pass an int for reproducible results across multiple function calls.
- Type
int, numpy.random.RandomState, optional, default=None
-
quiescent_wavelength¶ The index within the fitted parameters of the absorption Voigt line core wavelength.
- Type
int, default=1
-
active_wavelength¶ The index within the fitted parameters of the emission Voigt line core wavelength.
- Type
int, default=5
-
original_wavelengths¶ One-dimensional array of wavelengths that correspond to the uncorrected spectral data.
- Type
array_like
-
stationary_line_core¶ Wavelength of the stationary line core.
- Type
float, optional, default=8542.099145376844
-
neural_network¶ The
sklearn.neural_network.MLPClassifierobject (or similar) that will be used to classify the spectra. Defaults to asklearn.model_selection.GridSearchCVwithMLPClassifier(solver='lbfgs', hidden_layer_sizes=(40,), max_iter=1000)for best alpha selected from [1e-5, 2e-5, 3e-5, 4e-5, 5e-5, 6e-5, 7e-5, 8e-5, 9e-5].- Type
sklearn.neural_network.MLPClassifier, optional, default= see description
-
constant_wavelengths¶ The desired set of wavelengths that the spectral data should be rescaled to represent. It is assumed that these have constant spacing, but that may not be a requirement if you specify your own array. The default value is an array from the minimum to the maximum wavelength of original_wavelengths in constant steps of delta_lambda, overshooting the upper bound if the maximum wavelength has not been reached.
- Type
array_like, ndim=1, optional, default= see description
-
sigma¶ A list of different sigma that are used to weight particular wavelengths along the spectra when fitting. The fitting method will expect to be able to choose a sigma array from this list at a specific index. It’s default value is [generate_sigma(i, constant_wavelengths, stationary_line_core) for i in [1, 2]]. See
mcalf.utils.spec.generate_sigma()for more information. If bool, True will generate the default sigma value regardless of the value specified in config, and False will set sigma to be all ones, effectively disabling it.- Type
list of array_like or bool, length=(2, n_wavelengths), optional, default=[type1, type2]
-
prefilter_response¶ Each constant wavelength scaled spectrum will be corrected by dividing it by this array. If prefilter_response is not given, and prefilter_ref_main and prefilter_ref_wvscl are not given, prefilter_response will have a default value of None.
- Type
array_like, length=n_wavelengths, optional, default= see note
-
output¶ If the program wants to output data, it will place it relative to the location specified by this parameter. Some methods will only save data to a file if this parameter is not None. Such cases will be documented where relevant.
- Type
str, optional, default=None
-
array¶ Array holding spectra.
- Type
numpy.ndarray, dimensions are [‘time’, ‘row’, ‘column’, ‘spectra’]
-
background¶ Array holding spectral backgrounds.
- Type
numpy.ndarray, dimensions are [‘time’, ‘row’, ‘column’]
Attributes Summary
Methods Summary
classify_spectra([time, row, column, …])Classify the specified spectra.
fit([time, row, column, spectrum, …])Fits the model to specified spectra.
fit_spectrum(spectrum, **kwargs)Fits the specified spectrum array.
get_spectra([time, row, column, spectrum, …])Gets corrected spectra from the spectral array.
load_array(array[, names])Load an array of spectra.
load_background(array[, names])Load an array of spectral backgrounds.
plot([fit, time, row, column, spectrum, …])Plots the data and fitted parameters.
plot_separate(*args, **kwargs)Plot the fitted profiles separately.
plot_subtraction(*args, **kwargs)Plot the spectrum with the emission fit subtracted from it.
test(X, y)Test the accuracy of the trained neural network.
train(X, y)Fit the neural network model to spectra matrix X and spectra labels y.
Attributes Documentation
-
stationary_line_core
Methods Documentation
-
classify_spectra(time=None, row=None, column=None, spectra=None, only_normalise=False)¶ Classify the specified spectra.
Will also normalise each spectrum such that its intensity will range from zero to one.
- Parameters
time (int or iterable, optional, default=None) – The time index. The index can be either a single integer index or an iterable. E.g. a list, a
numpy.ndarray, a Python range, etc. can be used.row (int or iterable, optional, default=None) – The row index. See comment for time parameter.
column (int or iterable, optional, default=None) – The column index. See comment for time parameter.
spectra (numpy.ndarray, optional, default=None) – The explicit spectra to classify. If only_normalise is False, this must be 1D. However, if only_normalise is set to true, spectra can be of any dimension. It is assumed that the final dimension is wavelengths, so return shape will be the same as spectra, except with no final wavelengths dimension.
only_normalise (bool, optional, default=False) – Whether the single spectrum given in spectra should not be interpolated and corrected. If set to true, the only processing applied to spectra will be a normalisation to be in range 0 to 1.
- Returns
classifications – Array of classifications with the same time, row and column indices as spectra.
- Return type
See also
train()Train the neural network.
test()Test the accuracy of the neural network.
get_spectra()Get processed spectra from the objects array attribute.
Examples
Create a basic model:
>>> import mcalf.models
>>> import numpy as np
>>> wavelengths = np.linspace(8542.1, 8542.2, 30)
>>> model = mcalf.models.ModelBase(original_wavelengths=wavelengths)
Load a trained neural network:
>>> import pickle
>>> pkl = open('trained_neural_network.pkl', 'rb')
>>> model.neural_network = pickle.load(pkl)
Classify an individual spectrum:
>>> spectrum = np.random.rand(30)
>>> model.classify_spectra(spectra=spectrum)
array([2])
When
only_normalise=True, classify an n-dimensional spectral array:>>> spectra = np.random.rand(5, 4, 3, 2, 30) >>> model.classify_spectra(spectra=spectra, only_normalise=True).shape (5, 4, 3, 2)
Load spectra from a file and classify:
>>> from astropy.io import fits
>>> spectra = fits.open('spectra_0000.fits')[0].data
>>> model.load_array(spectra, names=['wavelength', 'column', 'row'])
>>> model.classify_spectra(column=range(10, 15), row=[7, 16])
array([[[0, 2, 0, 3, 0],
        [4, 0, 1, 0, 0]]])
-
fit(time=None, row=None, column=None, spectrum=None, classifications=None, background=None, n_pools=None, **kwargs)¶ Fits the model to specified spectra.
Fits the model to an array of spectra using multiprocessing if requested.
- Parameters
time (int or iterable, optional, default=None) – The time index. The index can be either a single integer index or an iterable. E.g. a list,
numpy.ndarray, a Python range, etc. can be used.row (int or iterable, optional, default=None) – The row index. See comment for time parameter.
column (int or iterable, optional, default=None) – The column index. See comment for time parameter.
spectrum (numpy.ndarray, ndim=1, optional, default=None) – The explicit spectrum to fit the model to.
classifications (int or array_like, optional, default=None) – Classifications to determine the fitted profile to use. Will use neural network to classify them if not. If a multidimensional array, must have the same shape as [time, row, column]. Dimensions that would have length of 1 can be excluded.
background (float, optional, default=None) – If provided, this value will be subtracted from the explicit spectrum provided in spectrum. Will not be applied to spectra found from the indices, use the
load_background()method instead.n_pools (int, optional, default=None) – The number of processing pools to calculate the fitting over. This allocates the fitting of different spectra to n_pools separate worker processes. When processing a large number of spectra this will make the fitting process take less time overall. It also distributes such that each worker process has the same ratio of classifications to process. This should balance out the workload between workers. If few spectra are being fitted, performance may decrease due to the overhead associated with splitting the evaluation over separate processes. If n_pools is not an integer greater than zero, it will fit the spectrum with a for loop.
**kwargs (dict, optional) – Extra keyword arguments to pass to
_fit().
- Returns
result – Outcome of the fits returned as a list of
FitResultobjects.- Return type
list of
FitResult, length=n_spectra
Examples
Create a basic model:
>>> import mcalf.models
>>> import numpy as np
>>> wavelengths = np.linspace(8541.3, 8542.7, 30)
>>> model = mcalf.models.ModelBase(original_wavelengths=wavelengths)
Set up the neural network classifier:
>>> model.neural_network = ...  # load an untrained classifier
>>> model.train(...)
>>> model.test(...)
Load the spectra and background array:
>>> model.load_array(...)
>>> model.load_background(...)
Fit a subset of the loaded spectra, using 5 processing pools:
>>> fits = model.fit(row=range(3, 5), column=range(200), n_pools=5)
>>> fits
['Successful FitResult with ________ profile of classification 0',
 'Successful FitResult with ________ profile of classification 2',
 ...
 'Successful FitResult with ________ profile of classification 0',
 'Successful FitResult with ________ profile of classification 4']
Merge the fit results into a
FitResultsobject:>>> results = mcalf.models.FitResults((500, 500), 8) >>> for fit in fits: ... results.append(fit)
See
fit_spectrum()examples for how to manually providing a spectrum to fit.
-
fit_spectrum(spectrum, **kwargs)¶ Fits the specified spectrum array.
Passes the spectrum argument to the
fit()method. For easily iterating over a list of spectra.- Parameters
spectrum (numpy.ndarray, ndim=1) – The explicit spectrum.
**kwargs (dict, optional) – Extra keyword arguments to pass to
fit().
- Returns
result – Result of the fit.
- Return type
See also
fit()General fitting method.
Examples
Create a basic model:
>>> import mcalf.models
>>> import numpy as np
>>> wavelengths = np.linspace(8541.3, 8542.7, 30)
>>> model = mcalf.models.ModelBase(original_wavelengths=wavelengths)
Quickly provide a spectrum and fit it. Remember that the model must be optimised for the spectra that it is asked to fit. In this example the neural network is not called upon to classify the provided spectrum as a classification is provided directly:
>>> spectrum = np.random.rand(30)
>>> model.fit_spectrum(spectrum, classifications=0, background=142.2)
Successful FitResult with ________ profile of classification 0
As the spectrum is provided manually, any background value must also be provided manually. Alternatively, the background can be subtracted before passing to the function, as by default, no background is subtracted:
>>> model.fit_spectrum(spectrum - 142.2, classifications=0)
Successful FitResult with ________ profile of classification 0
-
get_spectra(time=None, row=None, column=None, spectrum=None, correct=True, background=False)¶ Gets corrected spectra from the spectral array.
Takes either a set of indices or an explicit spectrum and optionally applied corrections and background removal.
- Parameters
time (int or iterable, optional, default=None) – The time index. The index can be either a single integer index or an iterable. E.g. a list, a
numpy.ndarray, a Python range, etc. can be used.row (int or iterable, optional, default=None) – The row index. See comment for time parameter.
column (int or iterable, optional, default=None) – The column index. See comment for time parameter.
spectrum (ndarray of ndim=1, optional, default=None) – The explicit spectrum. If provided, time, row, and column are ignored.
correct (bool, optional, default=True) – Whether to reinterpolate the spectrum and apply the prefilter correction (if exists).
background (bool, optional, default=False) – Whether to include the background in the outputted spectra. Only removes the background if the relevant background array has been loaded. Does not remove background is processing an explicit spectrum.
- Returns
spectra
- Return type
ndarray
Examples
Create a basic model:
>>> import mcalf.models
>>> import numpy as np
>>> wavelengths = np.linspace(8541.3, 8542.7, 30)
>>> model = mcalf.models.ModelBase(original_wavelengths=wavelengths)
Provide a single spectrum for processing, and notice output is 1D:
>>> spectrum = model.get_spectra(spectrum=np.random.rand(30))
>>> spectrum.ndim
1
Load an array of spectra:
>>> spectra = np.random.rand(3, 4, 30)
>>> model.load_array(spectra, names=['column', 'row', 'wavelength'])
Extract a single (unprocessed) spectrum from the loaded array, and notice output is 4D:
>>> spectrum = model.get_spectra(row=1, column=0, correct=False)
>>> spectrum.shape
(1, 1, 1, 30)
>>> (spectrum[0, 0, 0] == spectra[0, 1]).all()
True
Extract an array of spectra, and notice output is 4D, and with dimensions time, row, column, wavelength regardless of the original dimensions and order:
>>> spectrum = model.get_spectra(row=range(4), column=range(3))
>>> spectrum.shape
(1, 4, 3, 30)
Notice that the time index can be excluded, as the loaded array only represents a single time. However, in this case leaving out row or column results in an error as it is ambiguous:
>>> spectrum = model.get_spectra(row=range(4))
Traceback (most recent call last):
 ...
ValueError: column index must be specified as multiple indices exist
-
load_array(array, names=None)¶ Load an array of spectra.
Load array with dimension names names into the array parameter of the model object.
- Parameters
array (numpy.ndarray, ndim>1) – An array containing at least two spectra.
names (list of str, length=`array.ndim`) – List of dimension names for array. Valid dimension names are ‘time’, ‘row’, ‘column’ and ‘wavelength’. ‘wavelength’ is a required dimension.
See also
load_background()Load an array of spectral backgrounds.
Examples
Create a basic model:
>>> import mcalf.models
>>> from astropy.io import fits
>>> wavelengths = [0.0, 10.0, 20.0, 30.0, 40.0, 50.0]
>>> model = mcalf.models.ModelBase(original_wavelengths=wavelengths)
Load spectra from a file:
>>> spectra = fits.open('spectra_0000.fits')[0].data
>>> model.load_array(spectra, names=['wavelength', 'column', 'row'])
-
load_background(array, names=None)¶ Load an array of spectral backgrounds.
Load array with dimension names names into background parameter of the model object.
- Parameters
array (numpy.ndarray, ndim>0) – An array containing at least two backgrounds.
names (list of str, length=`array.ndim`) – List of dimension names for array. Valid dimension names are ‘time’, ‘row’ and ‘column’.
See also
load_array()Load and array of spectra.
Examples
Create a basic model:
>>> import mcalf.models
>>> from astropy.io import fits
>>> wavelengths = [0.0, 10.0, 20.0, 30.0, 40.0, 50.0]
>>> model = mcalf.models.ModelBase(original_wavelengths=wavelengths)
Load background array from a file:
>>> background = fits.open('background_0000.fits')[0].data
>>> model.load_background(background, names=['column', 'row'])
-
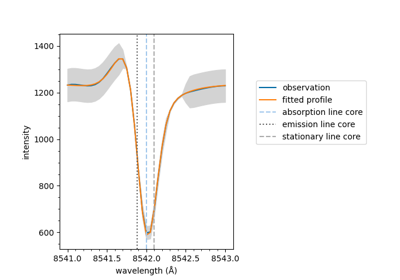
plot(fit=None, time=None, row=None, column=None, spectrum=None, classification=None, background=None, sigma=None, stationary_line_core=None, **kwargs)[source]¶ Plots the data and fitted parameters.
- Parameters
fit (mcalf.models.FitResult or list or array_like, optional, default=None) – The fitted parameters to plot with the data. Can extract the necessary plot metadata from the fit object. Otherwise, fit should be the parameters to be fitted to either a Voigt or double Voigt profile depending on the number of parameters fitted.
time (int or iterable, optional, default=None) – The time index. The index can be either a single integer index or an iterable. E.g. a list,
numpy.ndarray, a Python range, etc. can be used. If not provided, will be taken from fit if it is aFitResultobject, unless a spectrum is provided.row (int or iterable, optional, default=None) – The row index. See comment for time parameter.
column (int or iterable, optional, default=None) – The column index. See comment for time parameter.
spectrum (numpy.ndarray, length=`original_wavelengths`, ndim=1, optional, default=None) – The explicit spectrum to plot along with a fit (if specified).
classification (int, optional, default=None) – Used to determine which sigma profile to use. See
_get_sigma()for more details. If not provided, will be taken from fit if it is aFitResultobject, unless a spectrum is provided.background (float or array_like, length=n_constant_wavelengths, optional, default= see note) – Background to added to the fitted profiles. If a spectrum is given, this will default to zero, otherwise the value loaded by
load_background()will be used.sigma (int or array_like, optional, default=None) – Explicit sigma index or profile. See
_get_sigma()for details.stationary_line_core (float, optional, default=`stationary_line_core`) – The stationary line core wavelength to mark on the plot.
**kwargs (dict) –
Other parameters used to adjust the plotting. See
mcalf.visualisation.plot_ibis8542()for full details.separate – See
plot_separate().subtraction – See
plot_subtraction().sigma_scale – A factor to multiply the error bars to change their prominence.
See also
plot_separate()Plot the fit parameters separately.
plot_subtraction()Plot the spectrum with the emission fit subtracted from it.
mcalf.models.FitResult.plot()Plotting method on the fit result.
Examples
-
plot_separate(*args, **kwargs)[source]¶ Plot the fitted profiles separately.
If multiple profiles exist, fit them separately. Arguments are the same as the
plot()method.See also
plot()General plotting method.
plot_subtraction()Plot the spectrum with the emission fit subtracted from it.
mcalf.models.FitResult.plot()Plotting method on the fit result.
-
plot_subtraction(*args, **kwargs)[source]¶ Plot the spectrum with the emission fit subtracted from it.
If multiple profiles exist, subtract the fitted emission from the raw data. Arguments are the same as the
plot()method.See also
plot()General plotting method.
plot_separate()Plot the fit parameters separately.
mcalf.models.FitResult.plot()Plotting method on the fit result.
-
test(X, y)¶ Test the accuracy of the trained neural network.
Prints a table of results showing:
the percentage of predictions that equal the target labels;
the average classification deviation and standard deviation from the ground truth classification for each labelled classification;
the average classification deviation and standard deviation overall.
If the model object has an output parameter, it will create a CSV file (
output/neural_network/test.csv) listing the predictions and ground truth data.- Parameters
X (numpy.ndarray or sparse matrix, shape=(n_spectra, n_wavelengths)) – The input spectra.
y (numpy.ndarray, shape= (n_spectra,) or (n_spectra, n_outputs)) – The target class labels.
See also
train()Train the neural network.
-
train(X, y)¶ Fit the neural network model to spectra matrix X and spectra labels y.
Calls the
fit()method on the neural_network parameter of the model object.- Parameters
X (numpy.ndarray or sparse matrix, shape=(n_spectra, n_wavelengths)) – The input spectra.
y (numpy.ndarray, shape= (n_spectra,) or (n_spectra, n_outputs)) – The target class labels.
See also
test()Test how well the neural network has been trained.