MCALF
v0.2.1

Contents:

  • User Documentation
  • Example Gallery
    • Models
      • Working with IBIS data
      • Using IBIS8542Model
    • Visualisation
      • Plot a bar chart of classifications
      • Combine multiple classification plots
      • Plot a map of classifications
      • Plot a grid of spectra grouped by classification
      • Plot a fitted spectrum
      • Plot a map of velocities
      • Plot a spectrum
  • Code Reference
  • Contributor Covenant Code of Conduct
  • MCALF Licence
MCALF
  • »
  • User Documentation »
  • Example Gallery
  • Edit on GitHub

Example Gallery

Here are a collection of examples on how this package can be used.

Models

Below are examples of how to use the models included within the models module:
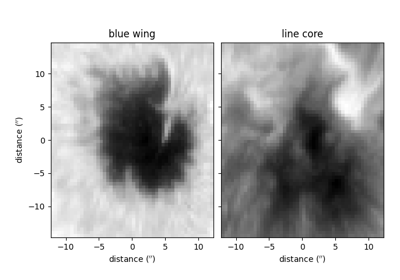
Working with IBIS data

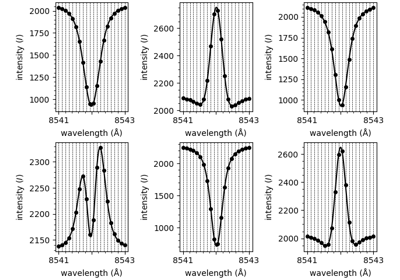
Working with IBIS data

Using IBIS8542Model

Using IBIS8542Model

Visualisation

Below are examples of plots produced using functions within the visualisation module:
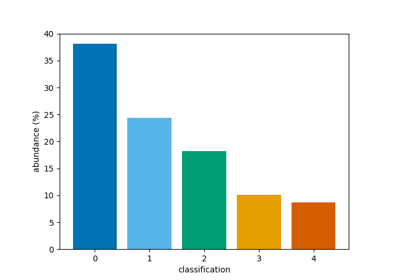
Plot a bar chart of classifications

Plot a bar chart of classifications

Combine multiple classification plots

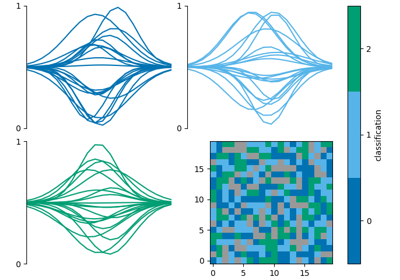
Combine multiple classification plots

Plot a map of classifications

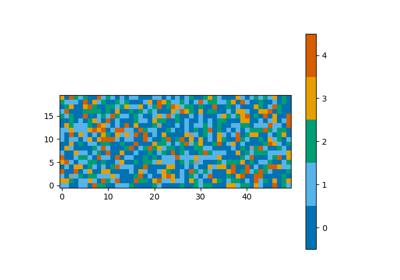
Plot a map of classifications

Plot a grid of spectra grouped by classification

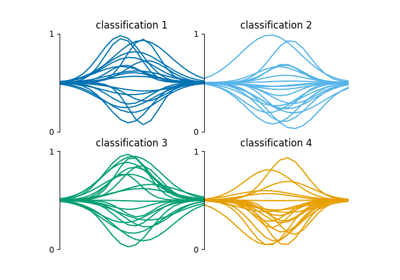
Plot a grid of spectra grouped by classification

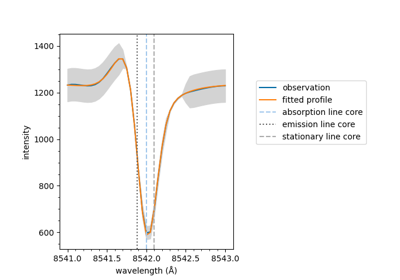
Plot a fitted spectrum

Plot a fitted spectrum

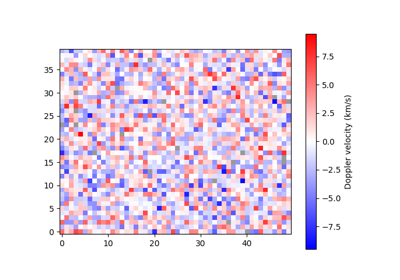
Plot a map of velocities

Plot a map of velocities

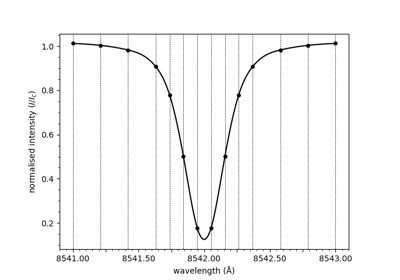
Plot a spectrum

Plot a spectrum

Download all examples in Python source code: gallery_python.zip

Download all examples in Jupyter notebooks: gallery_jupyter.zip

Gallery generated by Sphinx-Gallery

Next Previous

© Copyright 2021, Conor D. MacBride & David B. Jess Revision 5f7e6e71.

Built with Sphinx using a theme provided by Read the Docs.