Contents:
Here are a collection of examples on how this package can be used.
Below are examples of plots produced using functions within the visualisation module:
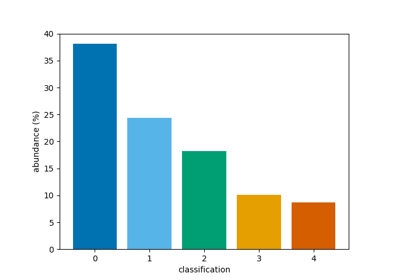
Plot a bar chart of classifications
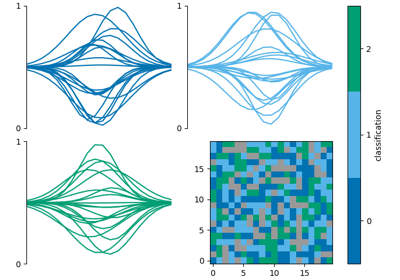
Combine multiple classification plots
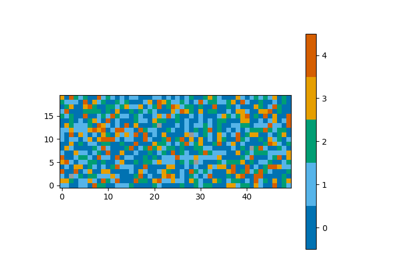
Plot a map of classifications
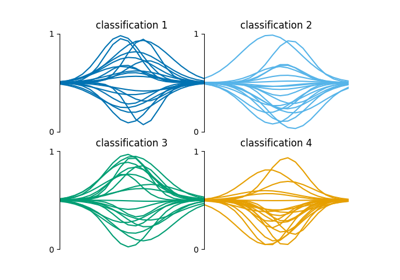
Plot a grid of spectra grouped by classification
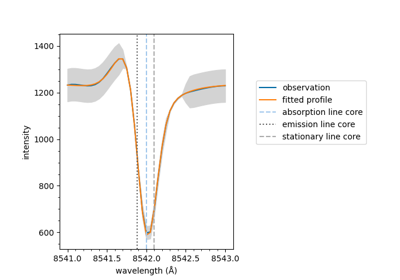
Plot a fitted spectrum
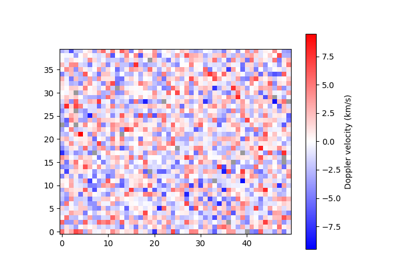
Plot a map of velocities
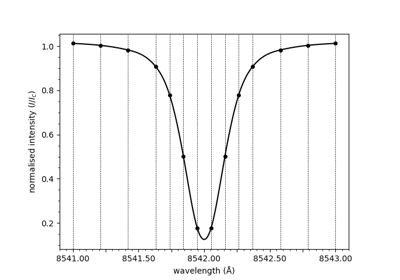
Plot a spectrum
Gallery generated by Sphinx-Gallery