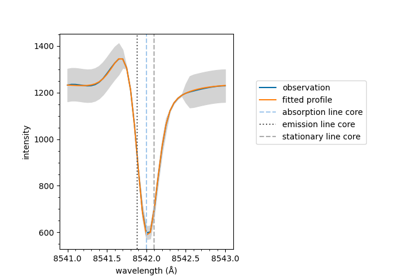
plot_ibis8542
- mcalf.visualisation.plot_ibis8542(wavelengths, spectrum, fit=None, background=0, sigma=None, sigma_scale=70, stationary_line_core=None, impl=<function voigt_faddeeva>, subtraction=False, separate=False, show_intensity=True, show_legend=True, ax=None)[source]
Plot an
IBIS8542Modelfit.Note
It is recommended to use the plot method built into either the
IBIS8542Modelclass or theFitResultclass instead.- Parameters:
wavelengths (numpy.ndarray) – The x-axis values.
spectrum (numpy.ndarray, length=n_wavelengths) – The y-axis values.
fit (array_like, optional, default=None) – The fitted parameters.
background (float or numpy.ndarray, length=n_wavelengths, optional, default=0) – The background to add to the fitted profiles.
sigma (numpy.ndarray, length=n_wavelengths, optional, default=None) – The sigma profile used when fitting the parameters to spectrum. If given, will be plotted as shaded regions.
sigma_scale (float, optional, default=70) – A factor to multiply the error bars to change their prominence.
stationary_line_core (float, optional, default=None) – If given, will show a dashed line at this wavelength.
impl (callable, optional, default=voigt_faddeeva) – The Voigt implementation to use.
subtraction (bool, optional, default=False) – Whether to plot the spectrum minus emission fit (if exists) instead.
separate (bool, optional, default=False) – Whether to plot the fitted profiles separately (if multiple components exist).
show_intensity (bool, optional, default=True) – Whether to show the intensity axis tick labels and axis label.
show_legend (bool, optional, default=True) – Whether to draw a legend on the axes.
ax (matplotlib.axes.Axes, optional, default=None) – Axes into which the fit will be plotted. Defaults to the current axis of the current figure.
- Returns:
ax – Axes the lines are drawn on.
- Return type:
See also
mcalf.models.IBIS8542Model.plotGeneral plotting method.
mcalf.models.IBIS8542Model.plot_separatePlot the fit parameters separately.
mcalf.models.IBIS8542Model.plot_subtractionPlot the spectrum with the emission fit subtracted from it.
mcalf.models.FitResult.plotPlotting method provided by the fit result.
Examples