init_class_data
- mcalf.visualisation.init_class_data(class_map, vmin=None, vmax=None, reduce=True, resolution=None, offset=(0, 0), dimension='distance', style='original', cmap=None, colorbar_settings=None, ax=None)[source]
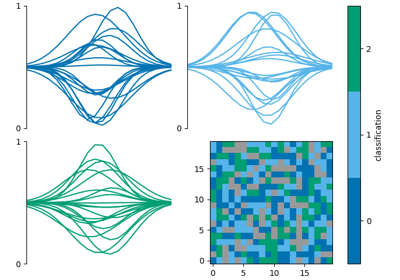
Initialise dictionary of common classification plotting data.
- Parameters:
class_map (numpy.ndarray[int], ndim=2 or 3) – Array of classifications. If reduce is True (default) and the array is three-dimensional, it is assumed that the first dimension is time, and a time average classification will be calculated. The time average is the most common positive (valid) classification at each pixel.
vmin (int, optional, default=None) – Minimum classification integer to include. Must be greater or equal to zero. Defaults to min positive integer in class_map. Classifications below this value will be set to -1.
vmax (int, optional, default=None) – Maximum classification integer to include. Must be greater than zero. Defaults to max positive integer in class_map. Classifications above this value will be set to -1.
reduce (bool, optional, default=True) – Whether to perform the time average described in class_map info.
resolution (tuple[float] or astropy.units.quantity.Quantity, optional, default=None) – A 2-tuple (x, y) containing the length of each pixel in the x and y direction respectively. If a value has type
astropy.units.quantity.Quantity, its axis label will include its attached unit, otherwise the unit will default to Mm. If resolution is None, both axes will be ticked with the default pixel value with no axis labels.offset (tuple[float] or int, length=2, optional, default=(0, 0)) – Two offset values (x, y) for the x and y axis respectively. Number of pixels from the 0 pixel to the first pixel. Defaults to the first pixel being at 0 length units. For example, in a 1000 pixel wide dataset, setting offset to -500 would place the 0 Mm location at the centre.
dimension (str or tuple[str] or list[str], length=2, optional, default='distance') – If an ax (and resolution) is provided, use this string as the dimension name that appears before the
(unit)in the axis label. A 2-tuple (x, y) or list [x, y] can instead be given to provide a different name for the x-axis and y-axis respectively.style (str, optional, default='original') – The named matplotlib colormap to extract a
ListedColormapfrom. Colours are selected from vmin to vmax at equidistant values in the range [0, 1]. TheListedColormapproduced will also show bad classifications and classifications out of range in grey. The default ‘original’ is a special case used since early versions of this code. It is a hardcoded list of 5 colours. When the number of classifications exceeds 5,style='viridis'will be used.cmap (str or matplotlib.colors.Colormap, optional, default=None) – Parameter to pass to matplotlib.axes.Axes.imshow. This parameter overrides any cmap requested via the style parameter.
colorbar_settings (dict, optional, default=None) – Dictionary of keyword arguments to pass to
matplotlib.figure.Figure.colorbar().ax (matplotlib.axes.Axes, optional, default=None) – Axes into which the classification map will be plotted. Defaults to the current axis of the current figure.
- Returns:
data – Common classification plotting settings.
- Return type:
See also
mcalf.visualisation.barPlot a bar chart of the classification abundances.
mcalf.visualisation.plot_class_mapPlot a map of the classifications.
mcalf.utils.smooth.mask_classificationsMask 2D and 3D arrays of classifications.
mcalf.utils.plot.calculate_extentCalculate the extent from a particular data shape and resolution.
mcalf.utils.plot.class_cmapCreate a listed colormap for a specific number of classifications.
Examples